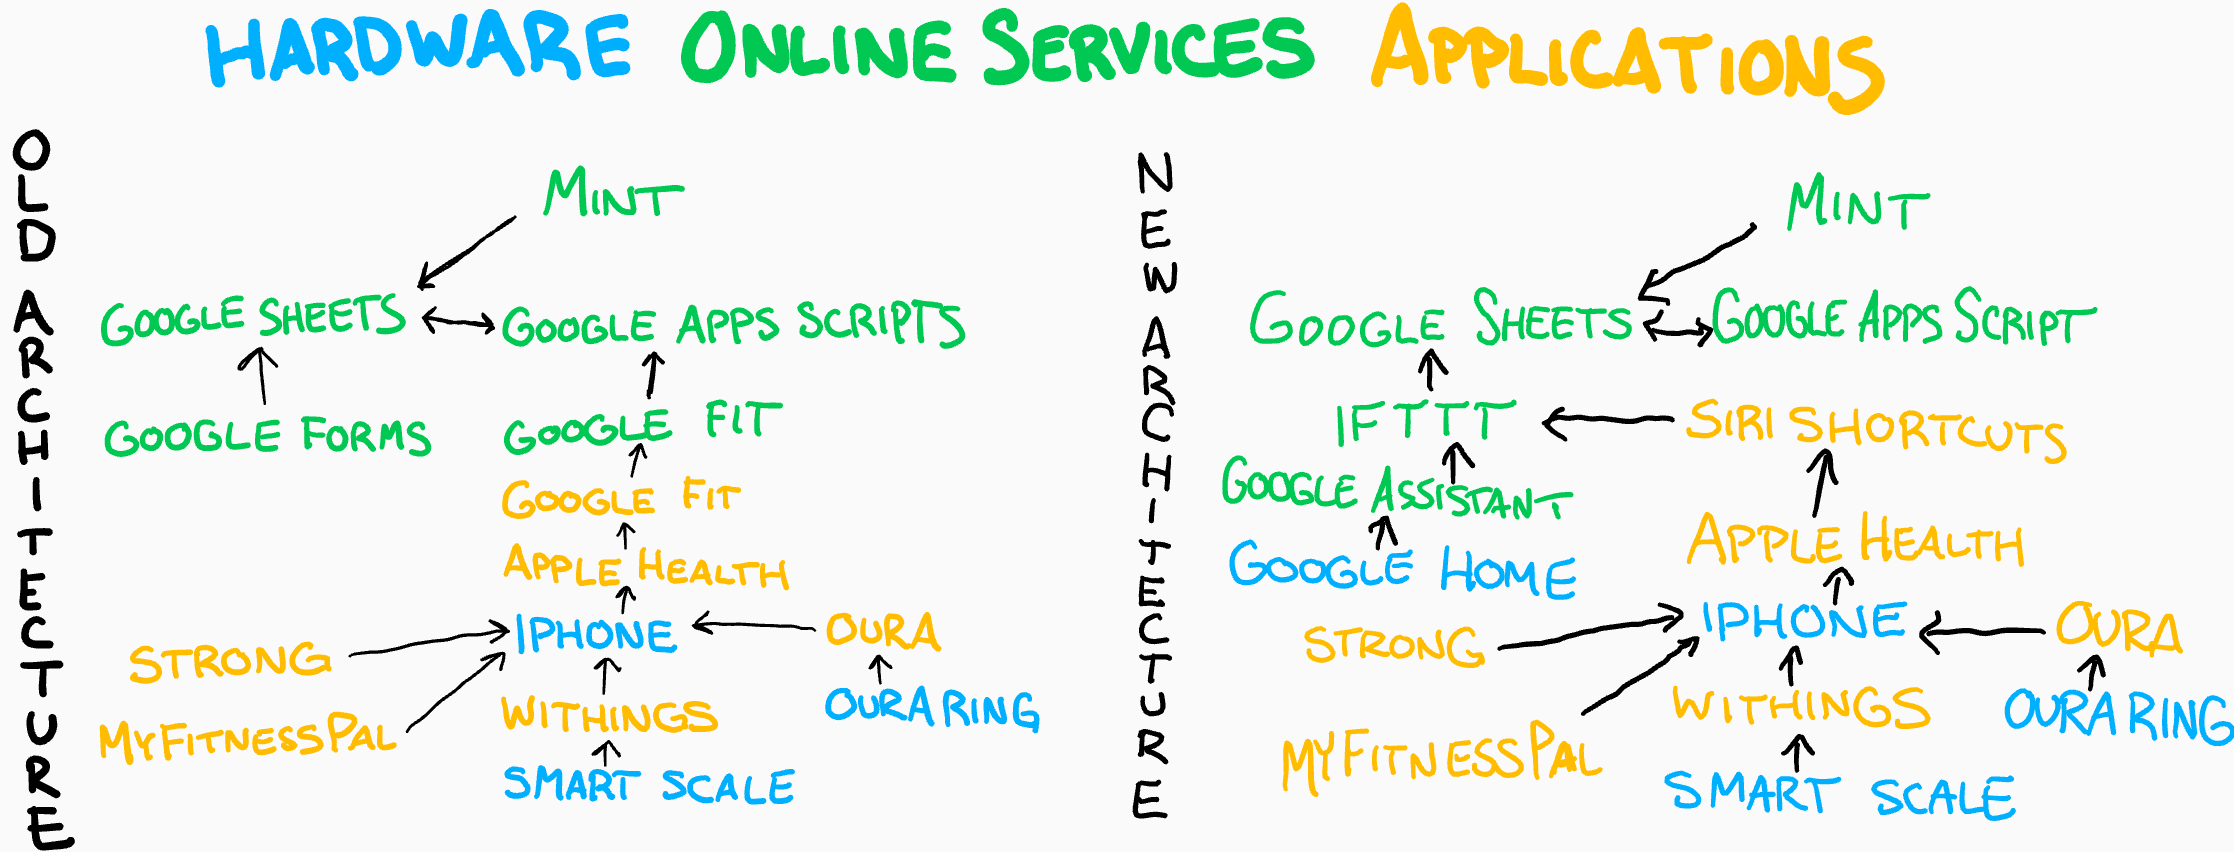
January’s 30 Day Challenge was to refactor the old “Life Tracker” into the “Data Journal” component of my new overall system. I wasn’t sure how much effort this endeavor was going to take. It wasn’t clear from the outset, but ultimately it was a burn-it-all-down undertaking.
In Short:

Background
Since the Life Tracker started in April, 2013, it was structured as a standard spreadsheet. Rows and columns. Each row was defined by a given period of time (day/week/month/year, depending on the sheet) and each column was associated with exactly one tracked data type, given by the column Header.

This structure offers many advantages. First it’s how spreadsheets are supposed to be structured. Formulas, pivot tables, and charts all work very nicely. It is familiar and easy to understand for humans and machines. You can use filters and sorting to look for trends. It has been a great, consistent piece of the concept since its inception.
There’s one limitation that a standard spreadsheet applications fails to handle well… a limitation I decided I no longer wanted to live with: multiplicity.
The intersection of a row and a column is one cell. One cell contains one value. One. You can try working around this limitation by using in-cell delimiters (e.g. commas), but you’re always fighting an uphill battle. Here’s a pretty simple scenario that played out last year - I wanted to know how many books I read. There are formulas for counting things, there are formulas for counting things based on conditions, there are methods of counting “unique” things… but none of those built-in methods can possibly recognize that the sequence of days below only contains two books:
- 1/1: “The Odyssey”
- 1/2: “The Odyssey, The Iliad”
- 1/3: “The Iliad”
This annoyance played out in a multitude of spots. How many books/TV shows/Movies/videogames did I consume? How many of each exercise routine did I do? How many days did I have tagged as “DayOff” and “Friends”?
The Pivot
In January I changed everything. All I did was change the data structure from a the standard intersection-of-row-and-column format to something more akin to a key:value pair… although in my case it’s more of a “couple keys:value” triple.

The new structure is a big step toward the de-spreadsheet-ification of the whole thing. I chose this methodology over creating a bunch of independent tables for each data type, then joining those into a master table (a SQL-like approach) because cloud service providers (read: Google, Amazon) seem to push new developers toward NoSQL over SQL for cloud-based applications… and the application would work in either format. Because I intend to wind up using their services to host my data, the approach was set for me.
The new approach made things easier, but also more difficult.
Simplifications:
- Multiple data points may exist for any given period
- All data exist in a common format
- Lookup routines need not worry about which column contains the data
- I can append new data to the Data Journal using a wide variety of applications and triggers, utilizing a common pattern
Complications:
- Standard spreadsheet formulas don’t work well (or at all, in most cases) in a key:value world
- Standard spreadsheet formatting is tedious, conditional formatting is a workaround at best
- Lookup routines now need to worry about which rows contain the data
- It’s much less obvious and intuitive to find missing data
It’s rare that things can be made better without an associated cost. These costs are ones I’m willing to live with, given the opportunities it affords me for automating inputs and the simplification (from a machine perspective) for grabbing a certain type of data from a certain period.
I end January having achieved pretty much all of the ultimate mission of the whole Data Journal concept: I want to build a permanently ongoing ledger of notes, measures, metrics, tasks, events, and other data which I can append throughout the day utilizing a number of automated and manual means.
Top 5: Enhanced Features, Post Re-write
- I’m now using a completely custom WebApp interface instead of Google Forms. I can make it look like whatever I want, and pull in data to show in my nightly review.
- The Data Manifest brought clarity to what I’m tracking & why.
- I can track multiple little notes throughout the day, and do it as simply as saying “Okay Google, Journal ______” to any Assistant-capable device.
- Thanks to integration with Siri Shortcuts and automations, I can automatically track anything that can trigger automations on my phone. And I made a homescreen’s worth of shortcuts for tracking various types of data.
- Thanks to the integration with IFTTT, I can automatically track ANYTHING that connects to IFTTT… the impact of this cannot be overstated. I have automatic logging enabled for anytime I leave (or enter) my house, any task I check off in Todoist, any Instagram post I post, and any Column I post. Adding new automations (such as my RescueTime daily screen time summaries) can be done in a matter of seconds.
Quotes
Ideas are easy. Execution is everything.
- John Doerr, author of “Measure What Matters”
