
IDEF0 Functional Modeling
The first IDEF (Integrated DEFinition) method deals with representing interrelated functions within an enterprise. They are an incredibly useful tool in situations ranging from Systems Engineering Analyses and Business Process Improvement efforts, down to more modest efforts such as “clarifying thought”. Of all the IDEF methods, IDEF0 creates the most immediately-parsable results. A complete IDEF0 Functional system model looks like a series of basic flow charts, consisting (only) of numbered & labeled boxes with numbered & labeled lines between them. Each box represents a function. Each arrow may represent an input to that function, something to control the function, an output of the function, or a mechanism which must be in place for the function to work. Together the group of Input, Control, Output, and Mechanism lines are referred to as ICOM Lines. Usually, but not always, the ICOM lines refer to physical (or digital) objects, sometimes with a specific state.
ICOM Definitions
Inputs
These are the things that are modified by the function to become the outputs. Inputs are “consumed” by the function. This is what separates them from Controls and Mechanisms. They answer the question of what the function acts on.
Examples:
- Ingredients for food
- Materials for buildings
- Raw data for computational functions
Controls
These are what tell the function how to produce the correct output. Controls can also be thought of as “constraints“ on the activity. They answer the question of how. Each function requires at least one documented Control. Controls are sometimes also consumed by the function, like inputs. In practice there is not a critical distinction between the two. Pick one and move on.
Examples:
- Documented (or unwritten) Standards
- Request forms
- Algorithms and recipes
Outputs
These are what the function exists to do. Creating the output is the implicit why for any given function. Outputs may be physical, or logical. Each function requires at least one documented Output. They may be the same as the inputs but with a modified state, such as in the case of “wiping the counters” which has input “dirty counters” and outputs “clean counters”. Outputs of one function may serve as inputs or controls of other functions, or they may circle around and feed back into the function itself, such as in the case of a Cruise Control Mechanism.
Examples:
- Food
- Goods
- Satisfied customers
Mechanisms
These are those things which the function needs to operate, but aren’t modified by it. Mechanisms describe the who and where of the function.
Examples:
- People
- Equipment
- Software
Calls
Calls are a strange “forgotten” member of the ICOM family (they didn’t even make the acronym). They are used less frequently, and the rules around their use are less well specified. The Call label is a pointer for where to find more information about the function. They may refer to diagrams in other models, or any form of reference material. They are used to avoid putting extraneous or redundant details into a diagram, while retaining the ability of the reader to find more information. A Call arrow extends from the bottom of the function, and points downwards. Calls, unlike all other arrows, do not bridge between functions in any one given diagram.
Call arrows may serve as a reference to multiple possible instantiations of the given function. A Functional Block titled “Process Request” may use a call arrow to reference multiple different cases of request processing that may be implemented.
Examples:
- Calls to diagrams in other models
- Calls to other reference materials
Anatomy
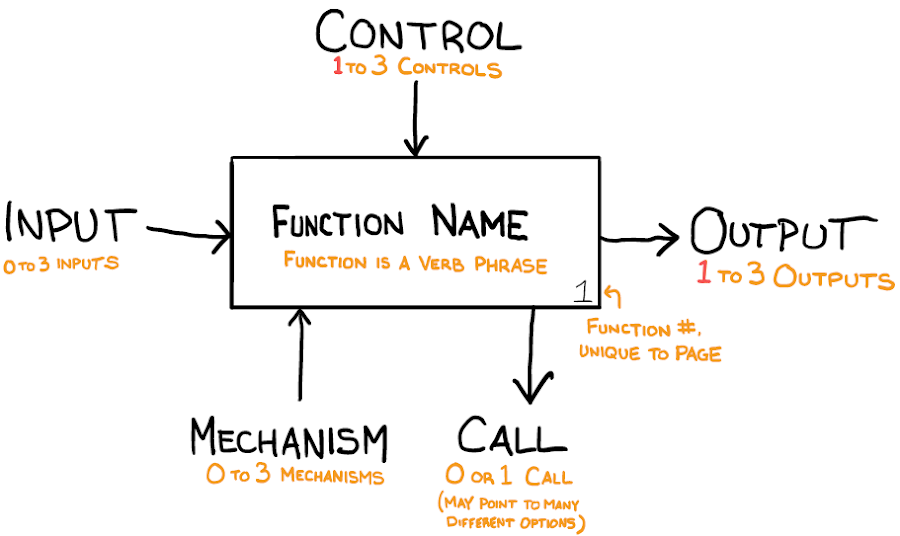
Function Blocks
The ICOM role that each arrow plays to the function is illustrated by which side of the box it touches.

“A-0” Top-Level Diagram
Each IDEF0 contains a single top-level diagram, referred to as “A-0” (pronounced “A minus Zero”), that bounds the scope of the function. It shows the main inputs, controls, outputs, and mechanisms needed by the function from the highest level. It also specifies why the diagram was made (its Purpose), and what viewpoint it represents (its Perspective).
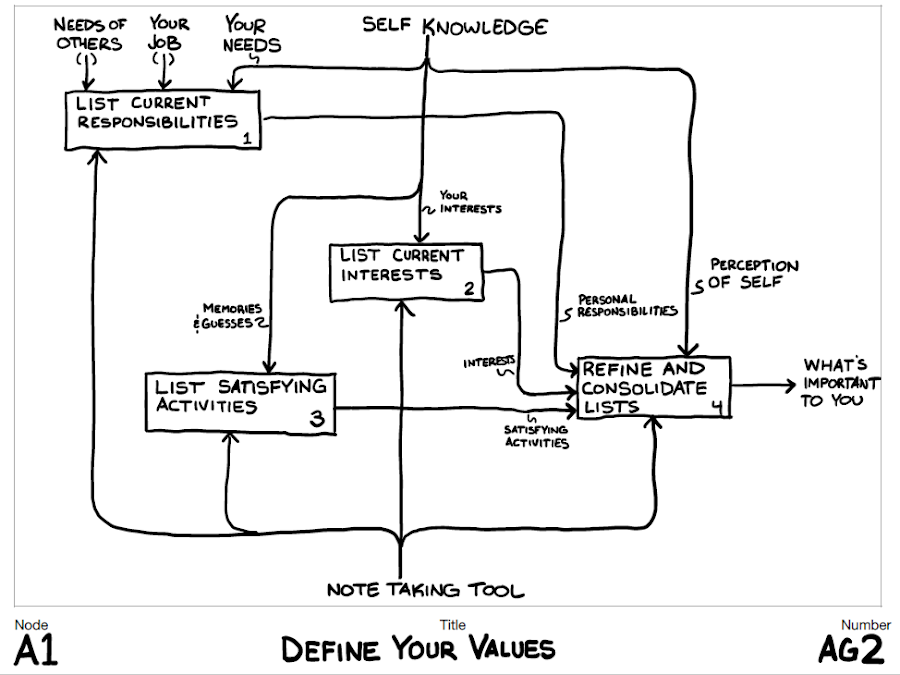
All Lower Levels Diagrams
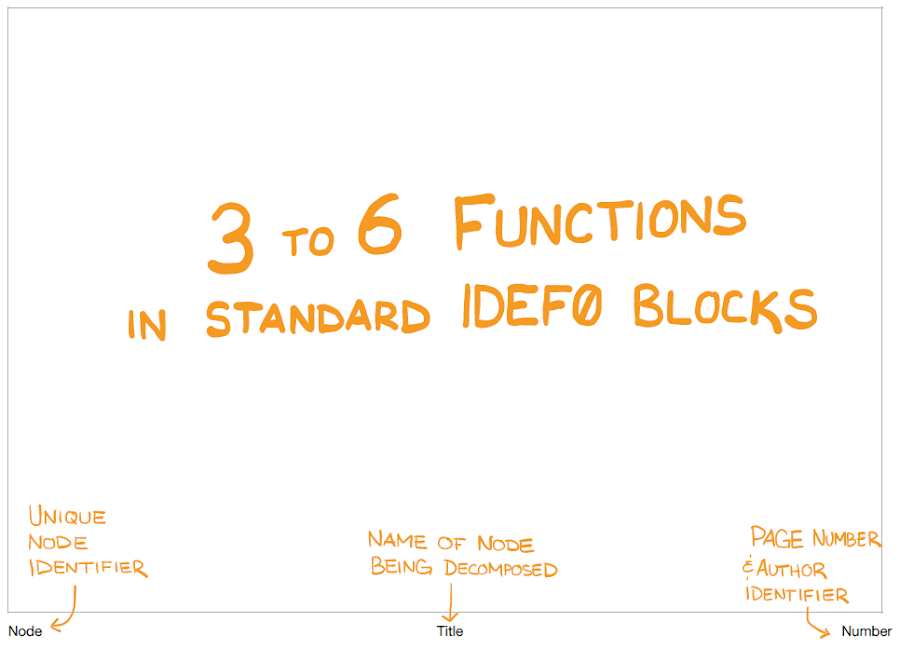
All diagrams that are NOT the top-level Context Diagram follow the same format and structure. They consist of between 3 and 6 functional blocks, with ICOM lines between them. All of these diagrams are decomposition diagrams (a.k.a. child diagrams) of some function that exists in a block above them in the hierarchy (a.k.a. the parent diagram). An entire model consists of an A-0 diagram, it’s decomposition (denoted “A0”) and a tree of nodes decomposing their parents. ICOM lines extending into a child diagram should correspond with the lines entering into that function on the parent diagram.
Conventions
There are standard conventions and rules of thumb all good IDEF0 diagrams follow. Below is an unordered list of standard practices.
- Do not “improve” the IDEF0 standard by adding things to it - its simplicity is its greatest strength
- Function blocks are named via active verb phrases (e.g. “Maintain accounts”, not “Accounting”)
- Arrows should be vertical or horizontal, and use rounded corners
- Arrows shall be labeled with short, helpful, and unique labels
- Wherever possible, prefer to describe what is done in an fashion that is agnostic to how it is done (e.g. “notify management” instead of “send email to management”) - unless the purpose of the model would be better served by the more specific function title
- All functions have at least one Control and at least one Output (see below)
Models
A IDEF0 model is a single set of connected diagrams with a common purpose, as stated on the Top-Level Diagram. A model may consist of two diagrams (A-0 and A0) or an arbitrarily large amount of decompositions. IDEF0 models consist (mostly) of standard IDEF0 diagrams, but they may contain a couple of other helpful pages, as shown in the rest of this article.
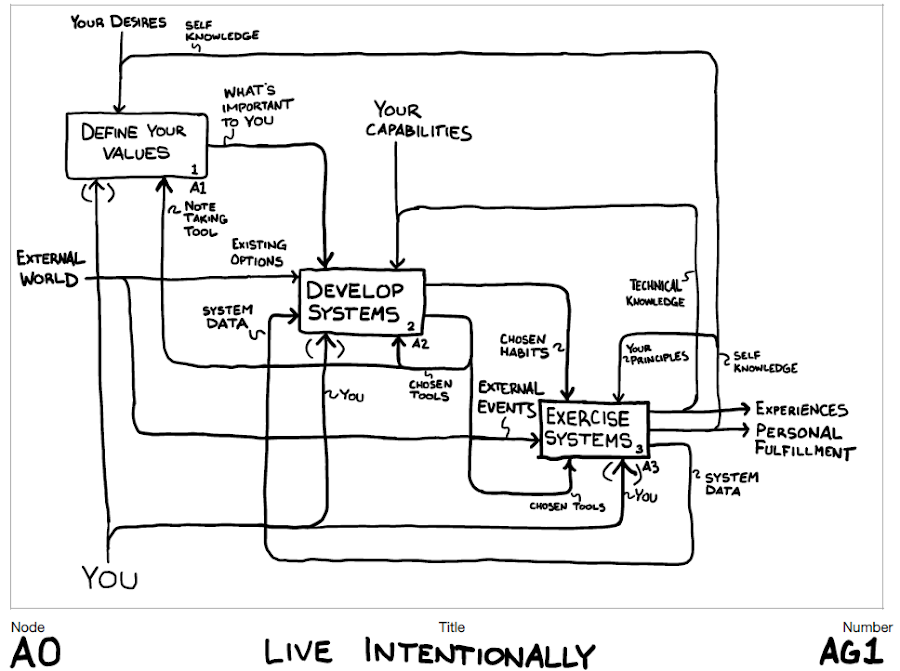
My Sample Model
I built a sample model for display here. It is a functional analysis of how to “Live Intentionally”. “Living Intentionally” is one of those vague terms that I think sounds nice, but doesn’t really mean anything to most people. When creating this model - I learned several things:
- These take time. This took days. It’s hard to produce something that, eventually, looks easy.
- They are worth it. The clarity of thought they bring is worth it by itself. They are also incredibly useful as a tool for explaining a complex system to an audience.
Top-Level Diagram
Each IDEF0 model starts with a context-setting top-level “A-0” diagram (pronounced “A minus 0”). It represents the entire system being modeled in a single block and shows the main inputs, controls, outputs, and mechanisms that are associated with the system.
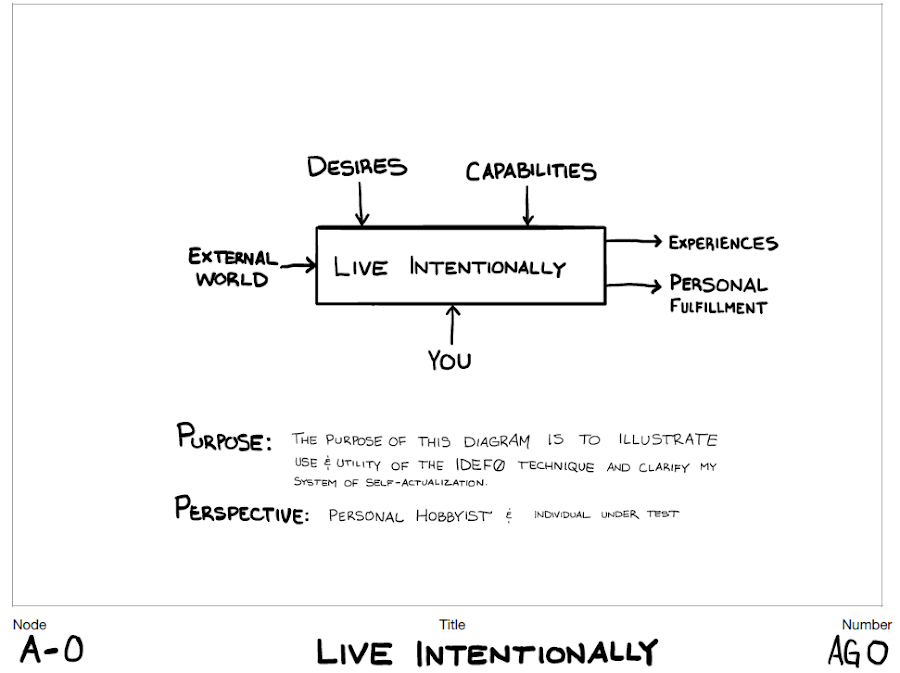
The top-level diagram is important! It sets the context for everything else contained in the model. It puts you and the reader on common terms before they have a chance to get lost in the details. The A-0 diagram also contains some brief explanatory text for the purpose of the diagram, and the perspective from which it was built. This is important at the outset of creating the model, as those pieces of information serve as guiding principles when considering questions like “should I show this?” later on.
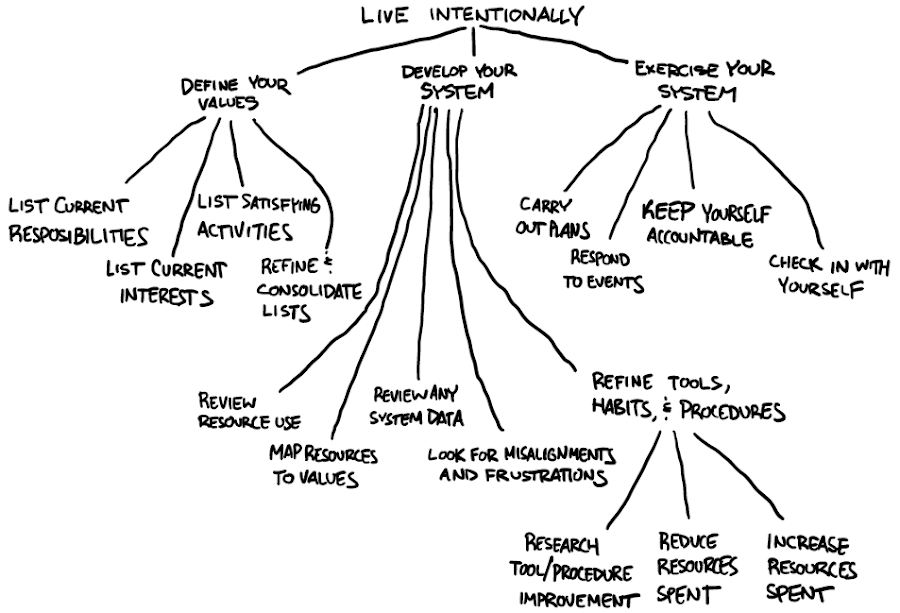
Node Diagrams
Node diagrams display the hierarchy of the model as defined by the functions it contains. The node diagram takes the shape of a tree, and gives an accurate overview of the contents of the model in a single picture. Like A-0 Diagrams, node diagrams are useful for summarizing and communicating the scope of a model’s content. They provide a bit more detail than the A-0 Diagram, while still fitting on a single page.
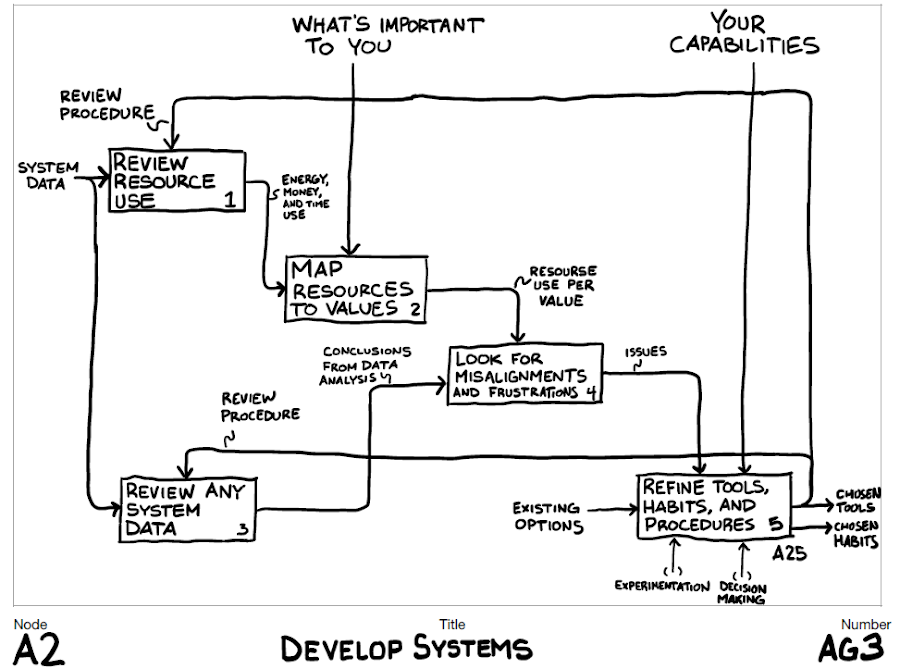
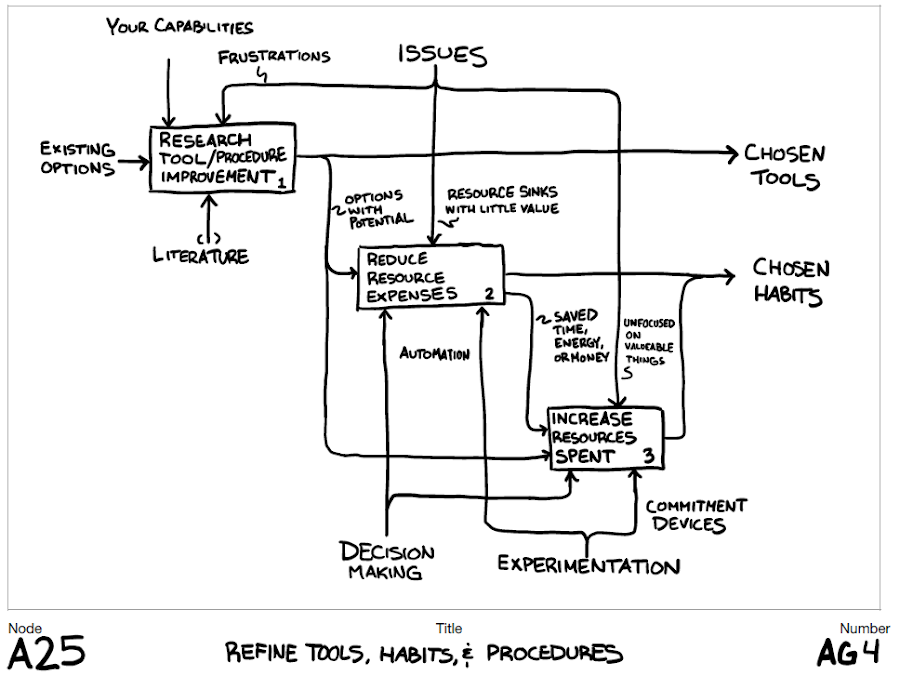
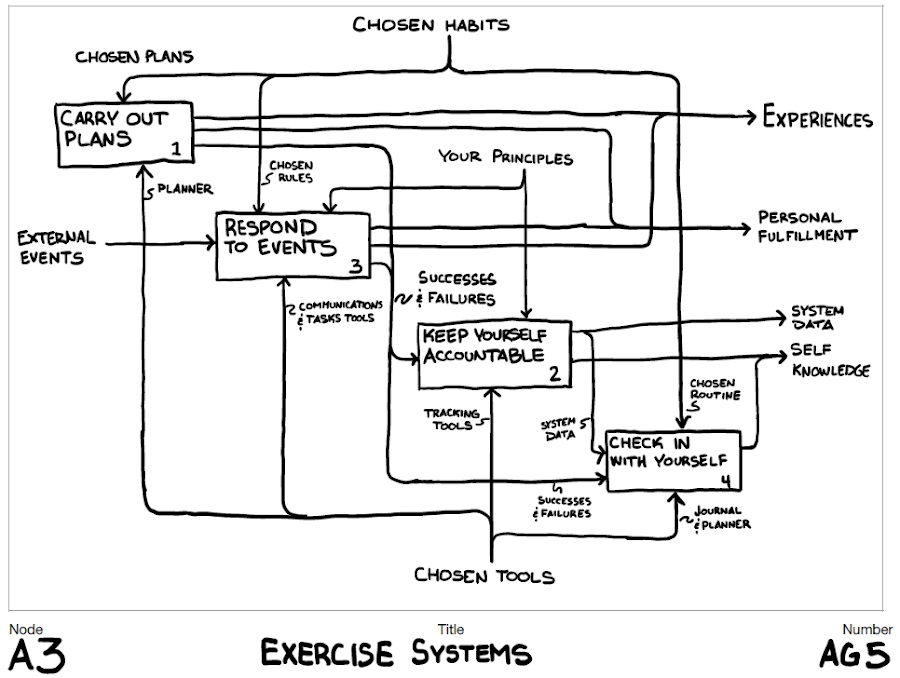
Standard IDEF0 Diagrams
This is the bulk of the model. These diagrams exist in several distinct pages, each telling their own part of the story. Each page contains enough detail to be relevant and useful divorced from the greater model, but also they are interconnected to each other by the boundary ICOM lines.
Schematics
A schematic is a view of the entire model in one, self-contained format. This is accomplished by replacing function blocks with their decompositions. You’re superimposing the top-level diagram with all diagrams below it.
Not all models require the creation of a schematic. The schematic contains no information that cannot be ascertained through analysis of the pages of the model. However, it may be easier for some individuals to picture the system as a whole with a picture of the whole system. Also creating a schematic will help you find inter-diagram errors and whole-model “global” trends more easily.
The schematic for the model above is presented here in a format that is not necessarily meant to be readable. To really read it you’d need a plotter (that’s what they call those huge huge printers) and an A01 size piece of paper.
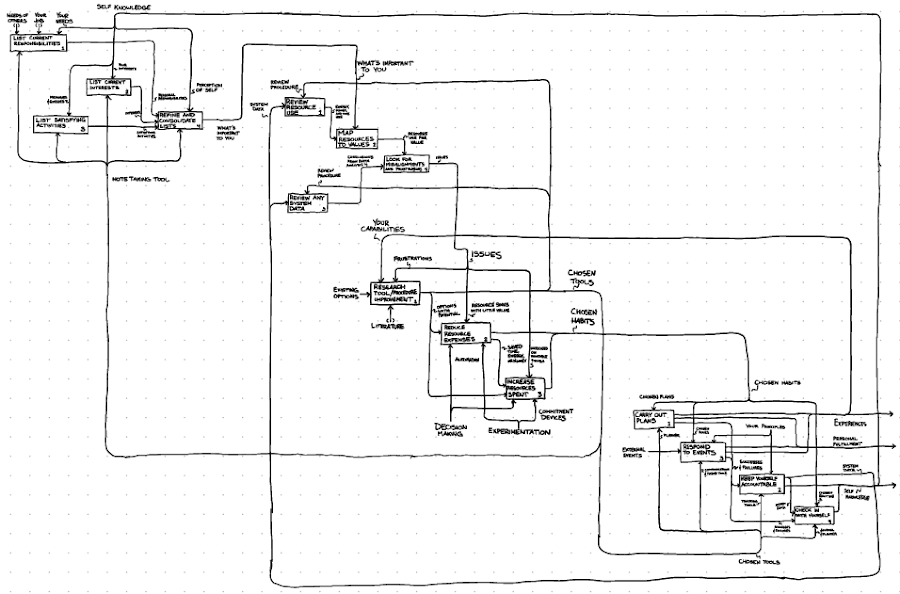
The purpose of a schematic is meant to enable the presentation of an entire model without the need for paper shuffling. This is the most effective method for walking through a model for its final review before release. It should be one of the last things you do, if you choose to do it at all.
Conclusion
IDEF0 Functional Modeling is cool. The diagrams the method produces are easy to learn, easy to parse, and quick to understand. The system can be applied to describe arbitrarily complex topics, and those topics can be broken down into arbitrarily granular detail. It’s a worthwhile skill to build, and a Inputs, Control, Output, and Mechanism mindset may help to serve you in all your problem solving endeavors.
-
“A0”, not to be confused with the Diagram whose Node Number is A0, is a reference to the A-series paper sizing standard size “A0”, which is short for “big ol’ piece of paper”. ↩